Why Contour Lines Gather Where the Ground Gets Steep
Learn why contour lines gather on steep ground and spread across gentle slopes, so you can read a map’s relief and anticipate changes in the land.
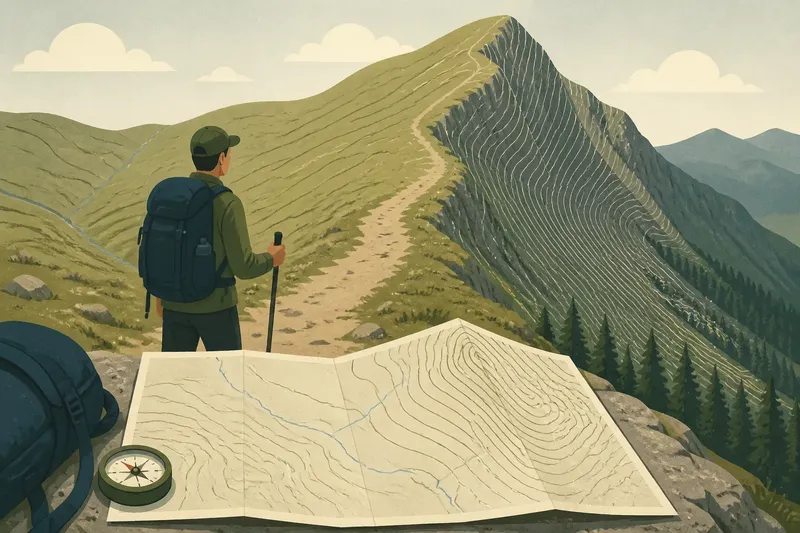
You are following a footpath towards a ridge when the contour lines on your map suddenly bunch together. That pattern tells you the ground rises sharply over a short horizontal distance; lines spread farther apart where the rise is gentler. Understanding why contour lines gather where the ground gets steep helps you picture the shape of the land before you reach it.
What do contour lines represent?
A contour line joins points at the same elevation above the map’s chosen reference level, commonly sea level. If you walked along one line while the mapped information were perfectly detailed, you would stay at roughly the same elevation, though the route might curve around hills, gullies and ridges.
Each line marks a particular elevation, rather than the steepness of the ground on its own. The pattern comes from comparing neighbouring lines: their elevation difference and their spacing together describe how the land changes.
A contour is a model of the ground, not a physical boundary or a walking route. Small features can be simplified or left out, particularly on maps that cover a large area.
Why do steep slopes have close lines?
Contour lines gather on steep slopes because the land climbs or falls quickly across a short horizontal distance. To represent successive elevation levels in that confined space, the map’s contours must sit near one another.
On a gentler slope, the same climb takes place over a broader stretch of ground, so the lines are farther apart. The spacing is therefore a visual clue to how rapidly elevation changes as you move across the map, not a direct measurement of slope angle by itself.
Imagine an invented situation: you are sketching a hill with a stack of flat, equally thick cardboard sheets, each representing the next band of elevation. A steep side narrows quickly as the sheets rise, so the outlines of neighbouring layers appear close together; a gentle side extends farther between layers, leaving more space between outlines. On a real map, the contour interval and map scale provide the context for interpreting those gaps.
At a glance, close lines mean that a short move across the map may involve a noticeable climb or descent. Give a tightly packed section a closer look before choosing where to cross it.
What does contour spacing tell you?
Spacing provides a relative picture of slope steepness when the contour interval is consistent across the map. Widely spaced contours usually mark gentler ground; tightly spaced contours usually mark steeper ground. A steady gap suggests a fairly even slope, while gaps that widen or narrow point to a change in gradient.
But spacing alone does not tell you the exact height of a hill, how far you will walk, or whether a slope can be crossed safely. It also does not tell you whether the ground is rocky, muddy, wooded or exposed. Those details may come from other map symbols or local conditions, and they can affect route choices just as much as the shape of the land.
- Close, even gaps: expect a sustained steep slope.
- Gaps that narrow uphill: the slope is becoming steeper.
- Gaps that widen uphill: the slope is becoming gentler.
- Widely spaced lines: expect a gentler rise or descent, not necessarily level ground.
- Lines that touch or nearly touch: check the map’s symbol conventions; this can represent an exceptionally steep feature such as a cliff.
Use these patterns as a reading of the land’s shape, not as a stand-alone judgement about whether a route is suitable.
How do contour intervals affect reading?
The contour interval is the elevation difference between successive contour lines. It is usually stated in the map legend or marginal information. A map with a small interval can show changes in elevation in finer bands than one with a larger interval, so do not compare line gaps across maps without checking their intervals and scales.
Index contours, often drawn more heavily and labelled with elevations, help you keep track of the sequence. Between labelled lines, count the intermediate contours and apply the stated interval. If the interval is unclear, avoid guessing the height change from appearance alone.
Map scale matters too. A gap that looks broad on a close-up map may cover a different ground distance from a similarly sized gap on a map of a larger area. The contour pattern remains useful for recognising relative steepness within one map, but scale helps put the spacing into distance terms.
How do contour shapes show landforms?
Lines are rarely just parallel bands. Their bends reveal whether a slope curves, forms a ridge, or dips into a hollow. Follow the shape of several neighbouring contours together; a single line may not give enough context to identify the feature.
- Closed loops: often indicate a hill when elevations rise towards the centre. Some maps use short inward ticks, called hachures, to mark a hollow or depression instead.
- V-shaped bends: where contours cross a stream valley, the V commonly points uphill, towards the higher ground and the stream’s source.
- Long, outward bulges: can trace a ridge or spur projecting from higher ground. The shape and surrounding elevations help confirm which feature you are seeing.
- Rounded, closely nested lines: can indicate a summit with steep sides; an elongated pattern may instead suggest a ridge.
These are clues, not labels attached to every bend. Read the contour heights and nearby watercourse or landform symbols as well, especially where the pattern is crowded.
What questions do walkers ask?
Do close contour lines always mean a cliff?
No. They usually show a steep slope, which may still be a continuous hillside. A cliff or other abrupt feature may have a specific symbol or convention, so check the legend rather than treating close lines alone as proof of a sheer drop.
Can widely spaced lines mean flat ground?
They can suggest very gentle ground, but widely spaced contours do not necessarily mean the surface is level. The land may still rise or fall gradually between lines, and small bumps or dips may be too minor to appear at that map’s level of detail.
Why do contours seem to cross a stream?
Contour lines can cross the mapped course of a stream because they show equal elevation, not barriers to water. Where the contour bends into a V at a valley, its shape helps indicate the direction of higher ground; the stream generally flows the other way.
Can I calculate slope from contour lines?
You can estimate how steep a section is by combining the contour interval with the horizontal distance between lines, using the map scale. A precise calculation also depends on how distance is measured and on the accuracy and detail of the mapped terrain, so a visual estimate is often more appropriate for ordinary route reading.
How should I read a steep section?
Start by locating the contour interval and any labelled index contours. Follow the lines across the slope, note where their gaps tighten or open, and look for a valley or ridge that could change the shape of the ascent. Then compare the pattern with paths, watercourses and other mapped features.
Say you are planning an invented walk to a hilltop and see a path approaching a band of tightly packed contours. You could compare that approach with a nearby route where the lines are more widely spaced, then check whether the alternative adds distance or crosses a valley. The map can help you anticipate a gentler-looking ascent, but it cannot establish current surface conditions or whether a route is appropriate for you.
When you are on the ground, compare the slope you see with the pattern on the map and keep track of your position using more than one feature. Contour spacing is most useful when it helps you form a sensible picture of the terrain, rather than when it is treated as a promise about what the path will feel like.
Remember the central clue: contour lines crowd together where elevation changes over little horizontal ground, and spread apart where that change takes more room. Read that spacing alongside the interval, map scale and contour shapes, and the lines become a practical way to anticipate the land ahead.